templates / grafana
Files
Tested with Grafana 13.2.
Threat map dashboards
Grafana dashboards for the database loaded by n8n/threatmap-feeds.
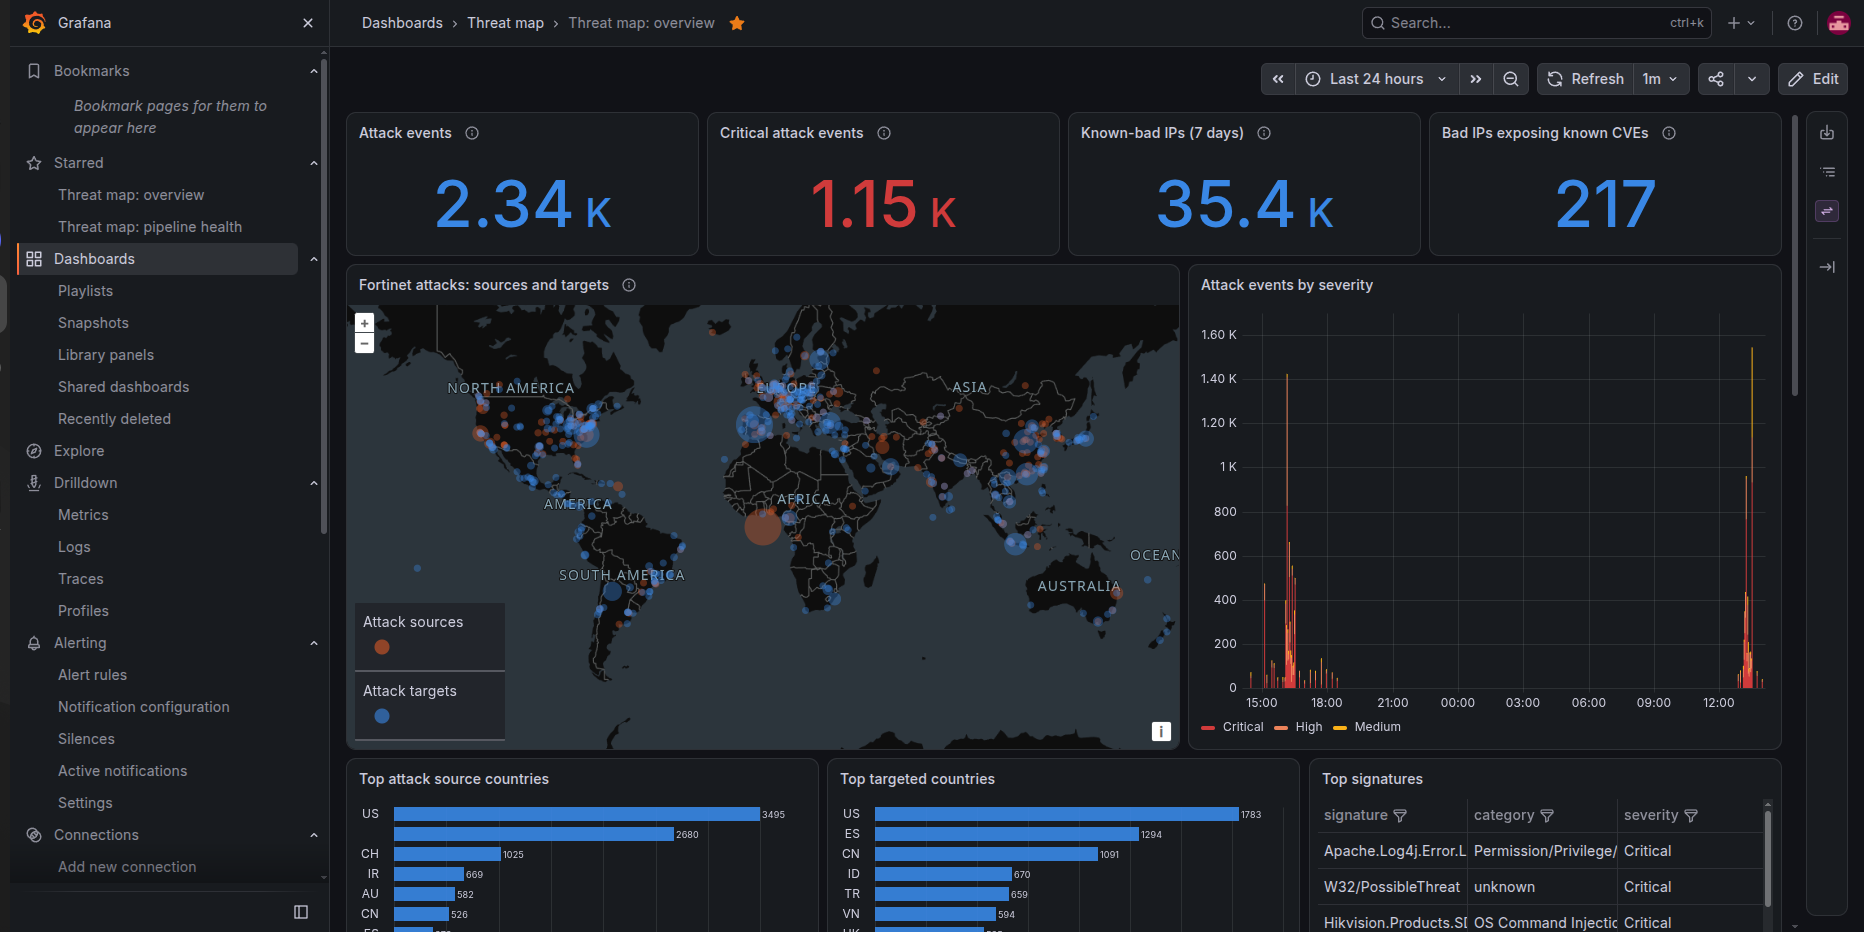
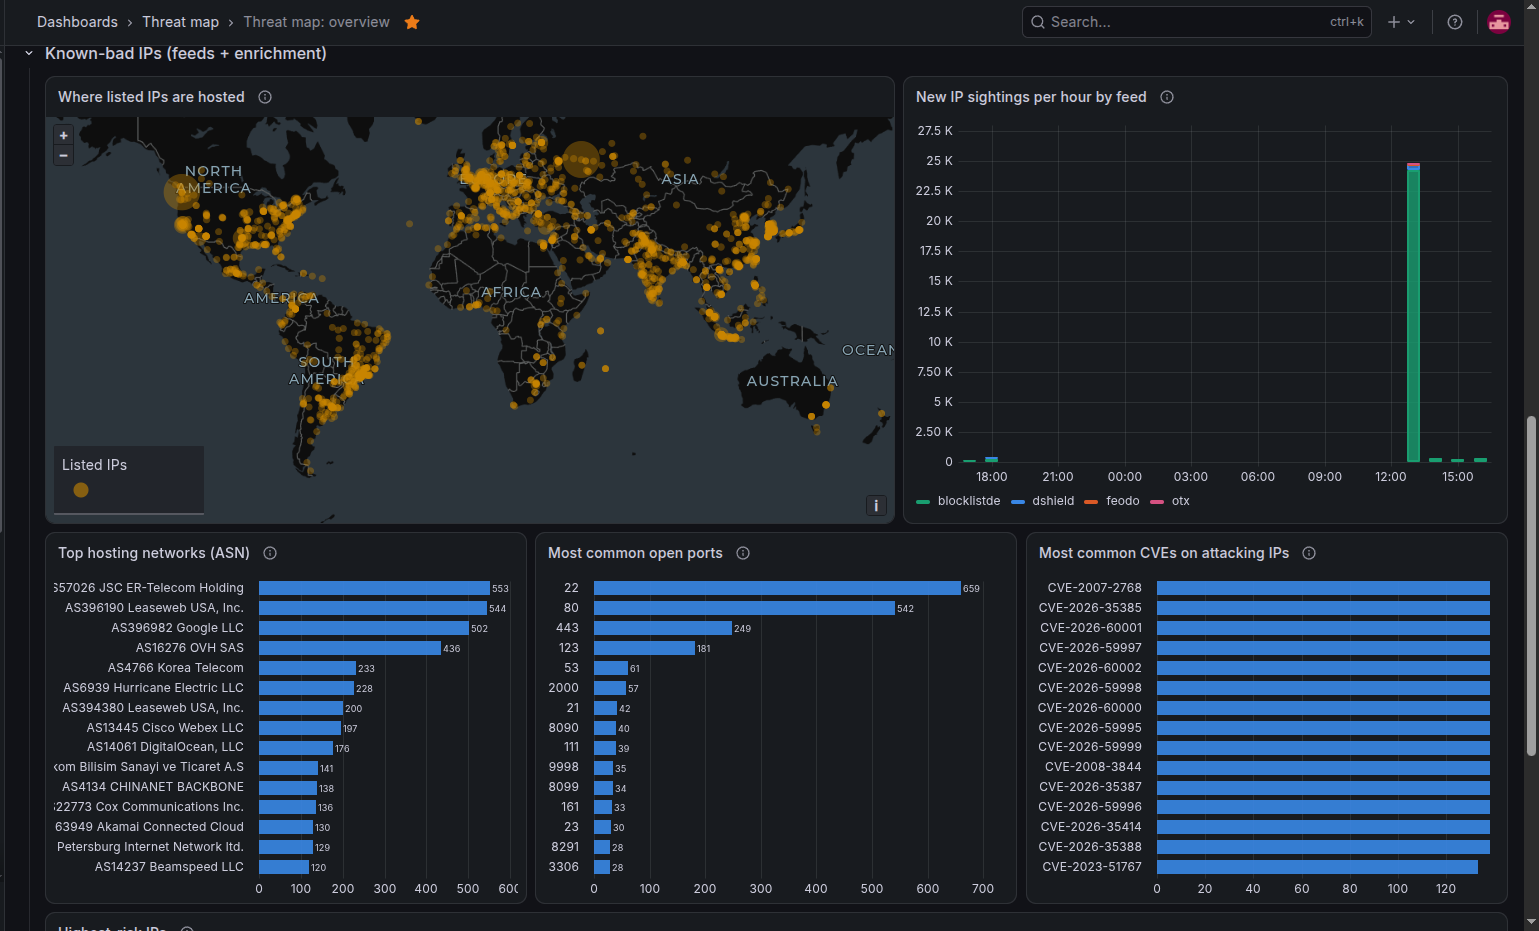
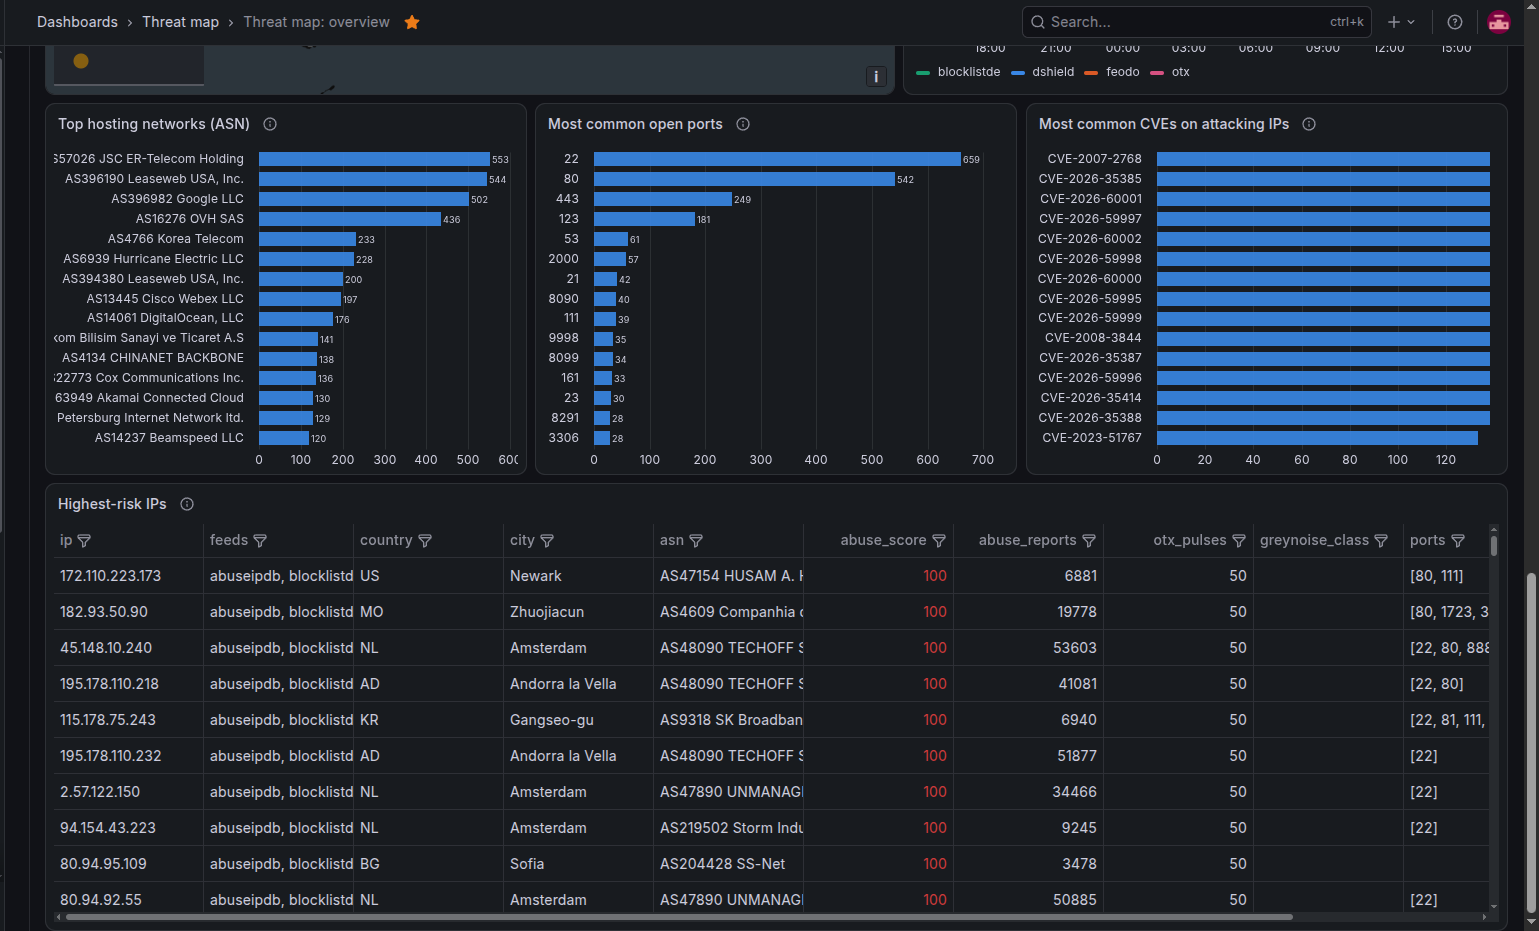
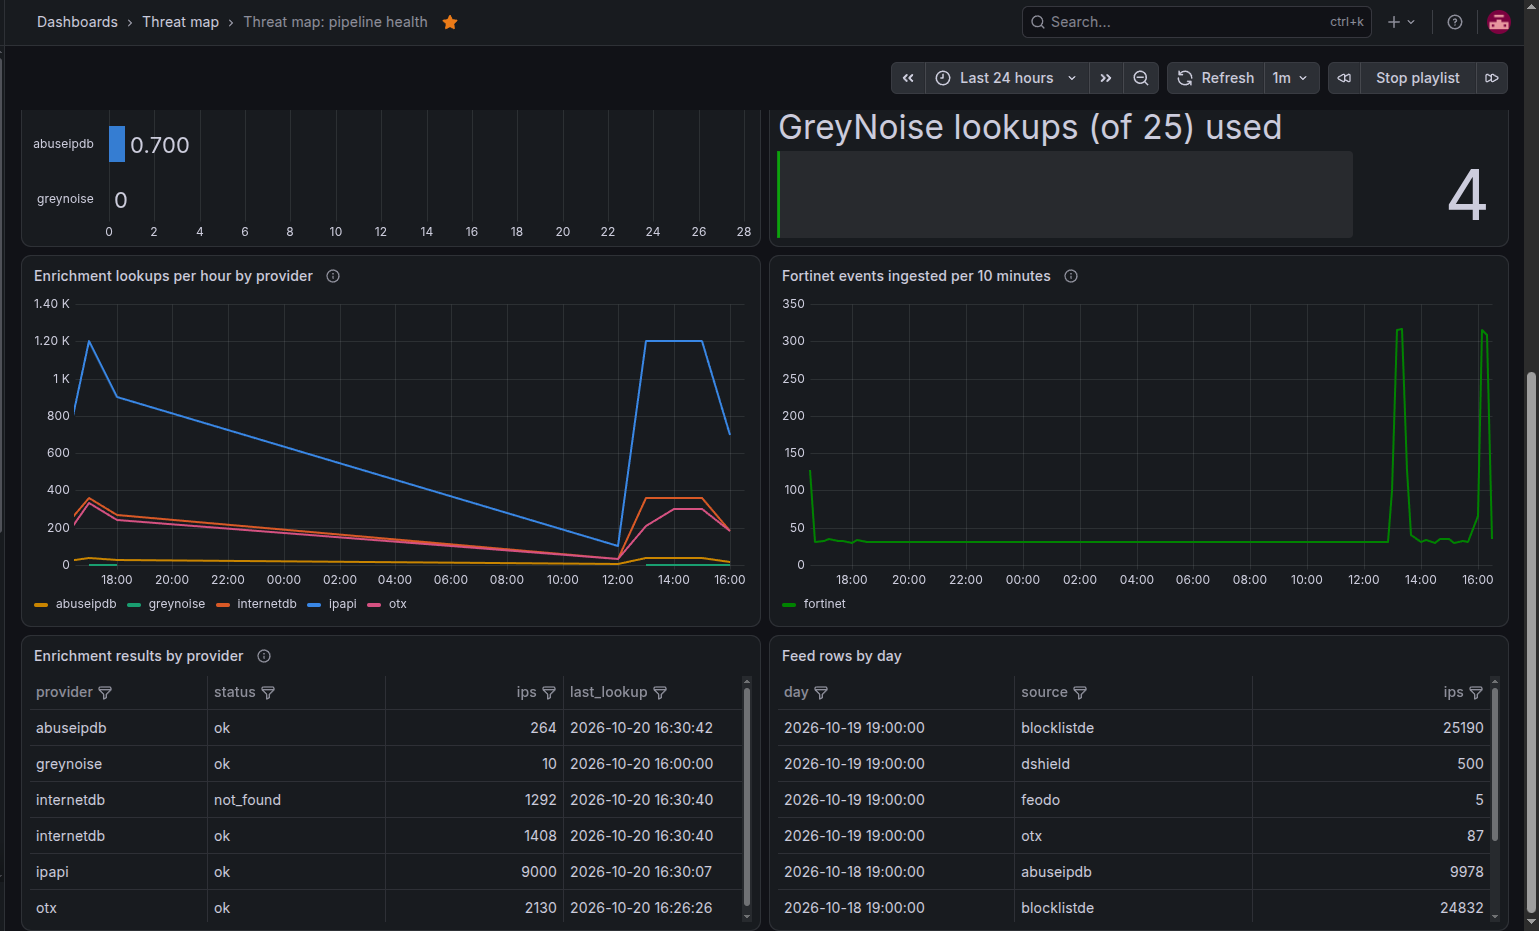
overview.json(Threat map: overview) shows a map of Fortinet attack sources and targets, severity, top source and target countries, signatures, hosting ASNs, open ports, CVEs on attacking IPs and the highest-risk IPs.pipeline.json(Threat map: pipeline health) shows ingest status, stale sources, enrichment coverage, API quota used today, database size and feed volume.
Screenshots
Threat map overview
Pipeline health
Import
- Add a PostgreSQL data source pointing at the
threatmapdatabase. A read-only user such asgrafana_ro, created bypostgres/threatmap/02-grafana-ro.sh, is recommended. Grafana’s-slimimage needs thegrafana-postgresql-datasourceplugin installed. - Go to Dashboards → New → Import, upload a JSON file, and choose that data source for Threatmap Postgres.
Provisioning instead
To provision rather than import, replace ${DS_THREATMAP} in each file with your data source’s uid, delete the __inputs and __requires blocks, and add a data source like this:
apiVersion: 1
datasources:
  - name: Threatmap
    type: grafana-postgresql-datasource
    uid: threatmap
    url: threatmap-postgres:5432
    user: grafana_ro
    jsonData: { database: threatmap, sslmode: disable }
    secureJsonData:
      password: $__file{/run/secrets/grafana_ro_password}